Source: Institute for Fiscal Studies (IFS) – Living standards, poverty and inequality in the UK: 2020
Notes:
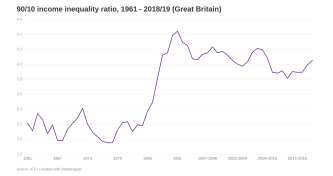
- The Gini coefficient is the most widely used summary measure of inequality in the distribution of household income; the lower the value, the more equally household income is distributed (Source: Office for National Statistics). The chart shows the Gini coefficient for Great Britain in calendar years between 1961 and 1993, and in financial years from 1993-94 to 2018-19.
- Incomes have been measured net of taxes and benefits, but before housing costs have been deducted, and have been equivalised using the modified OECD equivalence scale.
- Calculations used the Family Expenditure Survey (FES) for data covering the period of 1961 to 1993, and the Family Resources Survey (FRS) for data covering the period of 1994-95 to 2018-19.
About CLOSER
This page is part of Our Changing Society, a free resource developed by CLOSER to provide detailed information about the historical and political backdrop to study participants’ lives.
CLOSER’s mission is to increase the visibility, use and impact of longitudinal population studies, data and research to ensure that longitudinal evidence is used to address the health, social, economic and environmental challenges facing the UK, now and in the future.
Want to know more?
- Longitudinal News – Sign up to our monthly newsletter to hear about the latest news, blogs, research and events from the longitudinal community.
- Learning Hub – Find information and resources to help you better understand longitudinal population studies and how to use the data.
- CLOSER Discovery – Search and explore data in the UK’s most detailed search engine for longitudinal population studies.